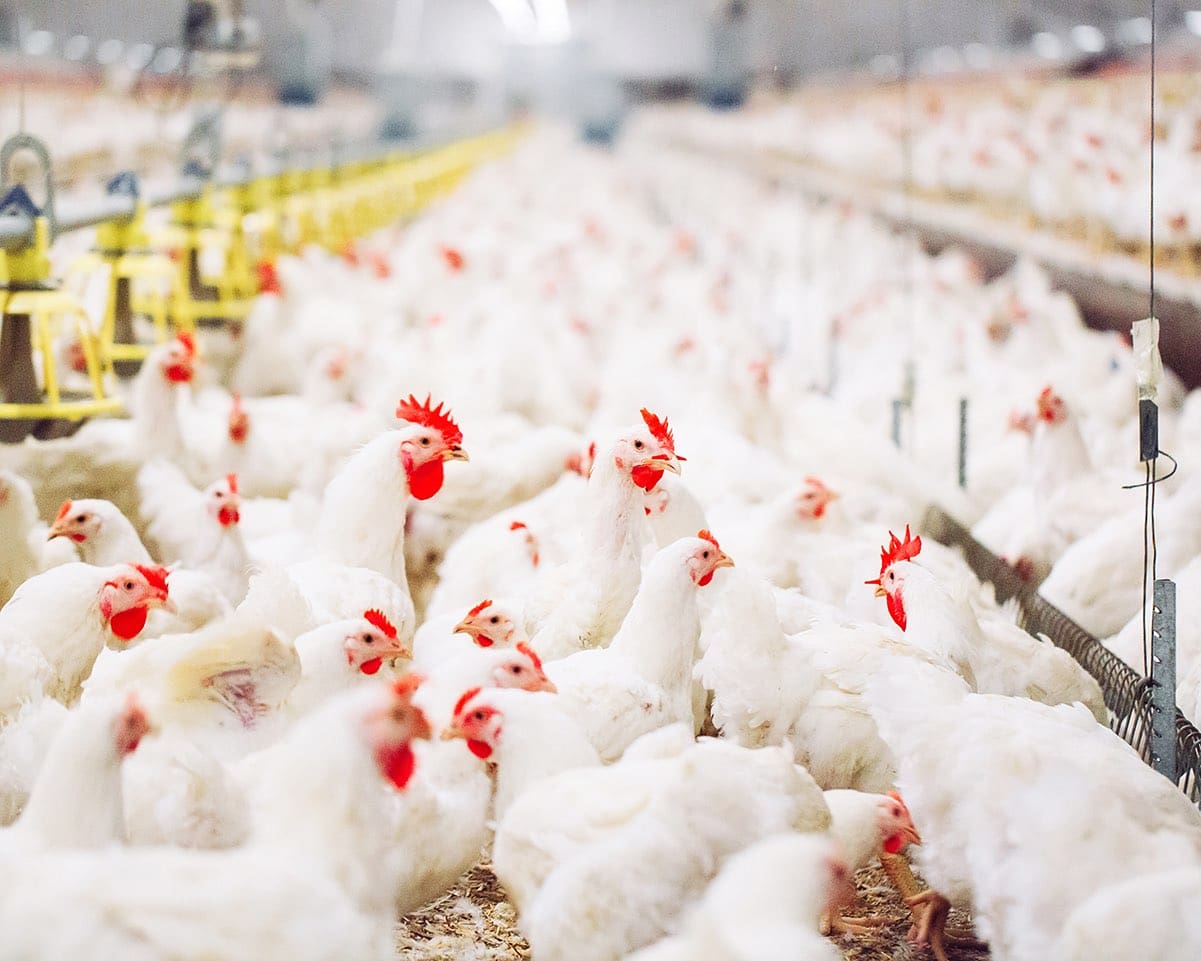
Why Americans are losing their taste for traditional Thanksgiving turkey this holiday season
This is a continuation of the prior part one story:
Year-to-date (YTD) retail fresh 16-24 lbs. turkey distribution is down -16% year-over-year (YoY), following the past two years which were down -29% and -12% YoY, respectively. This means that from 2021 to 2024, retail distribution on a YTD basis has decreased by -48%. In a country where the population has increased, why has whole turkey consumption decreased?
In the first part of this series, the cost component of Thanksgiving turkey was discussed. However, there’s another potential factor that could be playing a role in the decreased consumption of turkey. That is, not just the giving up or modification of tradition due to cost but changing traditions and belief systems altogether.
While debate exists surrounding whether Thanksgiving is classified as a Christian holiday, it certainly has some Christian history and traditions surrounding it. Thanksgiving, Christmas, New Year, and Easter (two of which are undoubtedly of Christian origin), are the four times of year in which the most whole Thanksgiving turkeys are sold at retail. Out of January, April, and October through December, the month with the lowest retail distribution is April (Easter) with a 3-year average distribution of 198 rings. This is 115% greater than the next largest average monthly retail distribution (92 rings in March) and 352% greater than the smallest average monthly retail distribution (44 rings in August). The month with the greatest distribution is without doubt November in which the average retail distribution is a whopping 2977% greater than that of August (1351:44 rings).
According to data from the Public Religion Research Institute, the percentage of sampled people who identified as a Protestant or Catholic in 2023 decreased by approximately -1.4% from the average responses of 2021 to 2023. Changes in religious affiliation could result in changes to the celebration of associated holidays, which may be partially responsible for the lower YoY retail distribution of whole turkeys.
Another potential factor, besides religious affiliation, in how the holidays important to the turkey industry are celebrated is the changing ethnic demographic of the U.S. According to the Center for Immigration Studies, there has been a 14.7% increase in the population of foreign-born individuals in the U.S from March 2021 to March 2024. Thanksgiving is an American holiday, so it is possible and plausible that many immigrants to the U.S. would not celebrate or would celebrate in ways that aren’t necessarily considered traditional. Additionally, turkey is a bird that is native to North America, so it could be expected that immigrants who celebrate holidays such as Christmas and Easter are more likely to enjoy a main dish other than turkey.
Mixed retail demand and pricing ahead of Thanksgiving lead to a softening in the market
Retail demand across the U.S. has grown increasingly varied this week, influenced by rising shelf prices and differing Thanksgiving preparation timelines among retailers. Over the past week, nearly all retail outlets have raised their shelf prices, reflecting last month’s more than 100% increase in wholesale values. However, these adjustments have been far from uniform. Large-scale chains are pricing conventional large eggs around $3.00 per dozen, while smaller, regional stores are seeing prices surge above $4.00—and, in some cases, even over $5.00 per dozen. This steep pricing has noticeably slowed demand in many regional outlets.
On the supply side, some suppliers are already experiencing strong inventory pulls in anticipation of the Thanksgiving rush. Others, however, don’t expect their holiday orders to ramp up until next week. These staggered preparations create a patchwork effect, making it difficult to pinpoint overall demand trends as Thanksgiving approaches.
Meanwhile, foodservice demand remains generally soft, as does export interest. Canadian buyers, who are typically reliable importers, are taking little to no cartoned product, and nest-run supply volumes have dwindled. Industry sources point to elevated market values as the likely reason for decreased interest, both domestically and abroad.
As demand cools across multiple channels, supply levels are quickly reaching a more balanced state. The USDA’s latest inventory report highlighted a 4% week-over-week rise in stocks, which has, in turn, led to reduced spot market buying interest and softening transactional values. Reflecting this shift, Expana’s extra-large and large graded loose indices dropped by five cents on Tuesday, suggesting a potential decline in quotations later this week.
Despite these signs of softening, uncertainty looms as Thanksgiving nears. With just three weeks left and the ongoing risk of bird flu, predicting the market’s trajectory remains challenging. This year’s low for Midwest Large stands at $1.64 per dozen—higher than the year-to-date average for three out of the last five years—underscoring the volatility the industry continues to face.
Karyn Rispoli
Expana
1-732-240-5330 ext 212
[email protected]
Chicken world markets trade data – total imports
When it comes to the total volume of chicken imported, the U.S. takes a back seat with a miniscule 69,000 metric tons (MT) imported this year. In comparison, Cuba, the tenth largest importer of chicken has bought 325,000 MT. This equates to approximately 0.44 lbs. imported chicken per person in the U.S. and 65.34 lbs. imported chicken per person in Cuba. The low volumes of chicken that the U.S. imports largely relate back to production. Since the U.S. is the largest producer of chicken, there is little need to import more chicken, even as the country with the largest domestic consumption. Interestingly, two of the top three countries that the U.S. imports chicken from are not among the top ten producers of chicken. These are Chile and Canada.
The U.S. and Chile have an agreement known as the Chile Free Trade Agreement. In short, this agreement allows for tariff-free trade between the two countries. Additionally, it protects U.S. investors and has resulted in Chile opening government procurements to U.S. bidders (International Trade Administration). This agreement started being implemented in 2004 and was fully phased in by 2015. Additionally, Chile is home to the company Agrosuper, which is the producer of one of only six broiler products that is certified American Humane and is the only foreign-made product that is certified. For these reasons, U.S. buyers are more incentivized to buy production from Chile than from one of the other top-producing countries such as China.
Year-to-date (YTD) Canada has exported 26.6 million lbs. of chicken into the U.S. Since Canada borders the U.S., there is more flexibility and ease with shipping production than is involved with overseas shipments. A notable trend to keep in mind is that volumes moved often relate to the exchange rates. Over the past ten years, on average, the USD has gained strength against the Canadian dollar from January through March before losing strength through June. The peak in the strength of the USD compared to the Canadian dollar in March correlates with a peak in imported volumes into the U.S.
For further insights, please watch our most recent meat webinar replay.


