Conflicting pressures within the Scallop Market
The Atlantic sea scallop sector is experiencing conflicting pressures based on scallop size as the 2024-2025 fishing year enters its third month of season open. Framework Adjustment 38 to the Atlantic sea scallop Fishery Management Plan has set an estimated harvest of 27.4 million pounds, a 2.4 million pound increase from the previous year, marking the first quota rise since 2019.
As expected, prices softened early in the season with the influx of harvested scallops. However, despite the increased quota, while 10/20 and 20/30 count sizes saw discounts, larger U10 scallops remained firm and even demanded premiums ahead of Mother’s Day weekend and continue to hold firm.
In 2023, the volume of U10s landed increased by 105% from 2022 according to the New Bedford auction. With Closed Area II remaining open this season, similar volume abundance is not expected, leading to early price increases for U10s.
The early establishment of premiums for larger scallops may shift demand towards mid-range sizes, potentially firming prices earlier in the season. In 2023, prices for 10/20 and 20/30 scallops overlapped, suggesting price points influence buying decisions.
As the season progresses, the scallop market will continue to evolve with significant regional and size-specific variations affecting overall market dynamics.
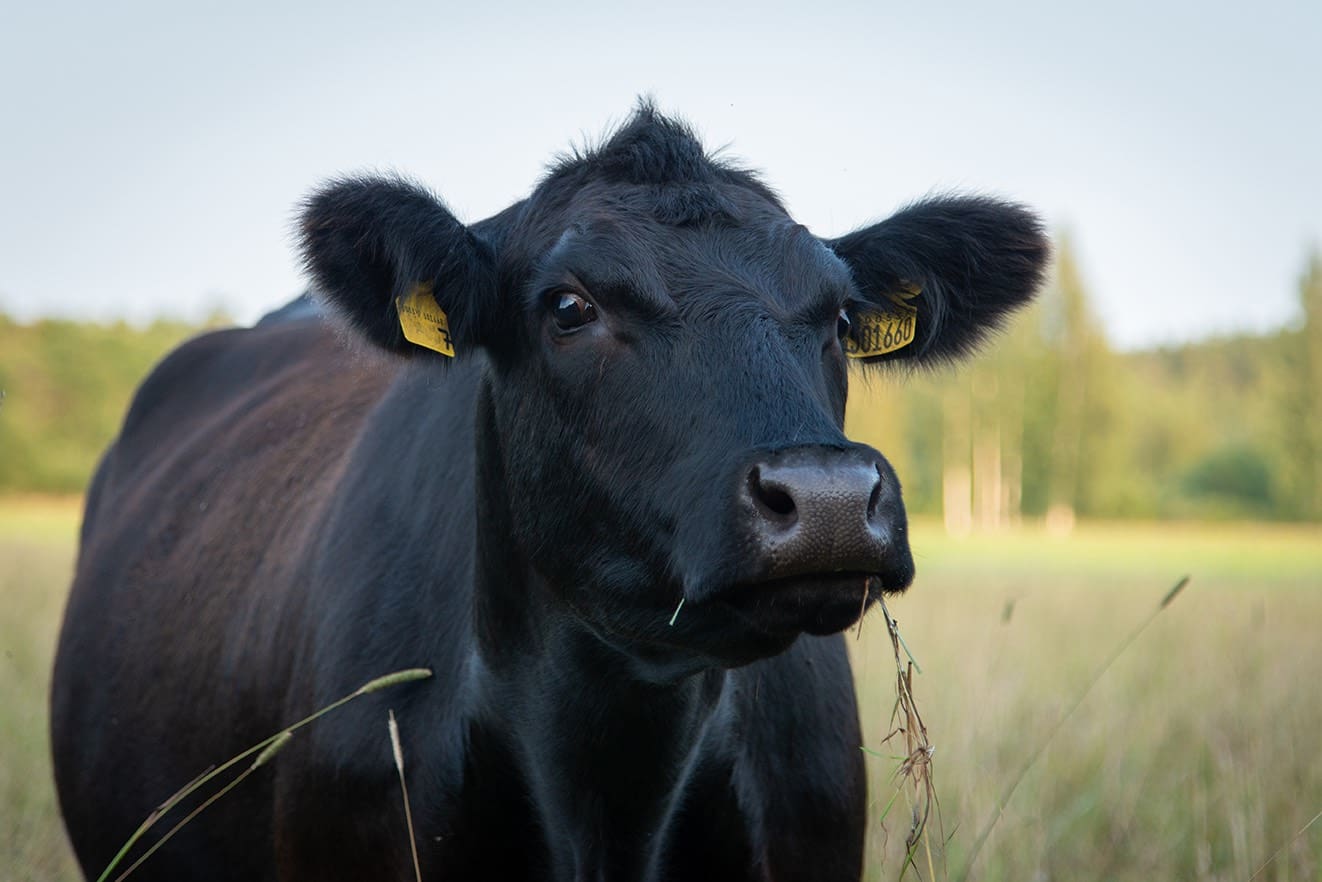
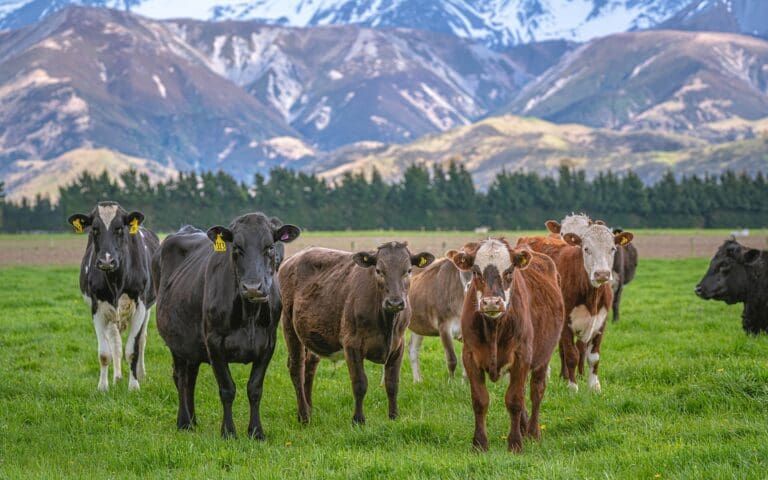
Longer time on feed for Cattle, produces higher quality
In last week’s blog, the boxed beef market discussed the sustained contra-seasonal trend of increasing cattle weights. This has been influenced by both long- and short-term factors. Cattle weights have been increasing for decades, averaging gains of 4-5 pounds annually. In the near term, tightening cattle supply in the current part of the cycle provides incentive to keep cattle feeding longer. Combine that with the record high prices paid and lower feed costs, and it is no wonder where that incentive lies. Recent reports indicate that cattle remain on feed for nearly 10 days (about 1 and a half weeks) longer. So higher weights are both a function of better breeding practices and longer time on feed.
One of the outcomes of longer feeding periods is better grading quality. Prime and choice grading percentage averaged 69 percent in 2014, steadily increasing to nearly 82 percent last year, and 84 percent so far this year.
Pollock supply in the European Market
The import of frozen fillets of Alaska Pollock into the European market has declined by 15.1% compared to year-to-date (YTD), reaching 62,083 MT. This decrease can be attributed to reduced imports from China and Russia, which have declined by 53.2% and 35.6%, respectively YTD.
Despite geopolitical uncertainties impacting supply chains, market stability remains consistent. In November 2023, the EU removed Russia from the list of countries benefiting from duty-free trade, resulting in a 13.7% tariff on Russian seafood imports. This measure has directly influenced the trade of Russian-origin pollock within the EU. In contrast, Alaska Pollock from the United States has grown by 82% YTD. The frozen fillets from the US took over the market gap that Russia left after the EU imposed sanctions.
The European economic sentiment is positive, with declining inflation rates. Demand for European groundfish is stable, and prices have increased slightly following recent events. Despite sanctions against Russia, Alaska Pollock prices in 2024 are significantly lower than last year. Market participants anticipate increased retail demand for pollock products as the European holiday season approaches.
Hog weights climb despite normal seasonal trends
Live hog weights continue to follow a more contra-seasonal trend compared to this time last year. According to the latest USDA Iowa-South Minnesota Live Weights – Barrows & Gilts weekly report, weights reached 290.4 pounds for the week of June 1, 2024. This represents an increase of 6.6 pounds from the same week last year. Notably, this figure is only 0.6 pounds below the highest weight ever recorded for this week since data collection began in 1998, which occurred in 2020 when COVID-19 led to a backlog in live hog supplies amid labor issues, resulting in hogs being kept on feed for a longer period.
When analyzing input costs, such as feed prices, the current trends are noteworthy. Omaha US No. 2 Yellow Corn and USDA Central Illinois Soybean prices are significantly lower year-over-year. Corn prices are trending about 31% lower, and soybean prices are approximately 15% lower compared to this same time last year. This reduction in feed costs is likely one of the influencing factors of heavier weights as producers may be feeding hogs longer, taking advantage of the more affordable feed.


