Weather and crop analysis
Leveraging weather and crop data analysis is essential for evaluating the impact of latest weather events on agricultural commodity markets and other industries, in order to minimize weather-driven supply chain disruptions.

Our expertise
Built on robust data and rigorous research, Expana offers highly tailored content for each commodity and region. This comprehensive analysis provides detailed insights into how weather events impact commodity markets in major producing countries throughout the season.
Weather maps
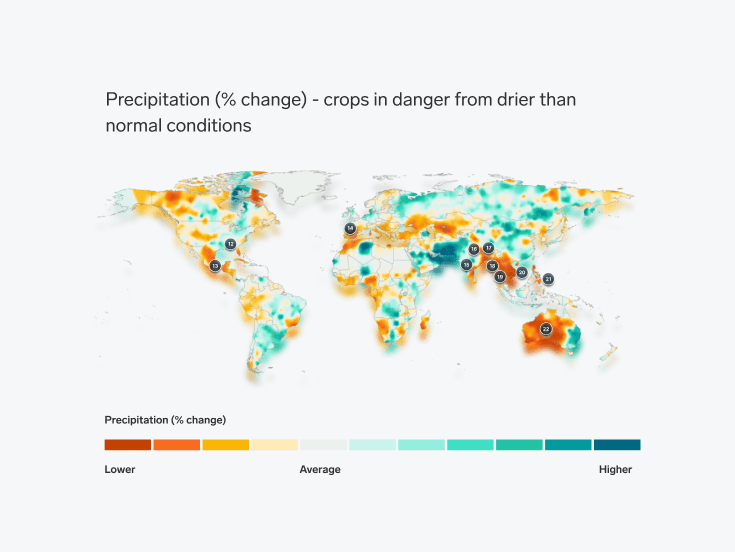
Commodity and country-specific weather maps provide insight into weather anomalies affecting both agricultural and non-food commodity markets. Our data compares current precipitation and temperature levels with a 30-year average, clearly identifying the most extreme cases.
Crop maps
Accurately analyze weather data with Expana’s crop maps showing current weather conditions in major crop-growing areas. Using targeted locations provides greater clarity on the conditions affecting relevant commodities.
Crop calendars
Track the various effects of weather on specific crops at different growing stages including flowering, planting or sowing, harvesting and others, all tailored to specific times of the year.
Comparison years
Enhance decision-making by comparing current weather conditions with historical data, using examples from years with high and low yields specific to each crop and region. Identify patterns in how weather has historically impacted crop yields to minimize the impact of weather-related uncertainty.
Critical conditions
Utilize Expana’s bespoke critical conditions to detect weather anomalies that could severely impact crop growth and yield. Meticulously researched and regularly updated, these critical conditions offer deep insights into specific crop sensitivities, empowering you to make proactive and informed decisions.
Storm analysis
Expana monitors tropical activity each day, providing detailed information on upcoming and completed storm tracks. We explore the impact of storms on crops and ports, and the scale of the subsequent wind and rainfall.
200+
Agricultural crops
300+
Geographies
220+
Brands that read our Weather Report
Vegetation index
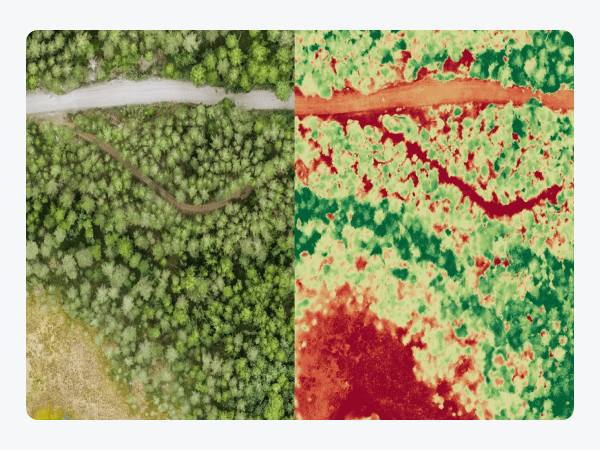
Satellite-derived vegetation indices, such as Normalized Difference Vegetation Index (NDVI) are great tools to better understand the state of vegetative health. Utilizing our indices enables greater insight into how weather conditions can impact crop growth, final yield and subsequently price fluctuations, providing a clearer view of progress among complex external variables.
El Niño /La Niña forecast
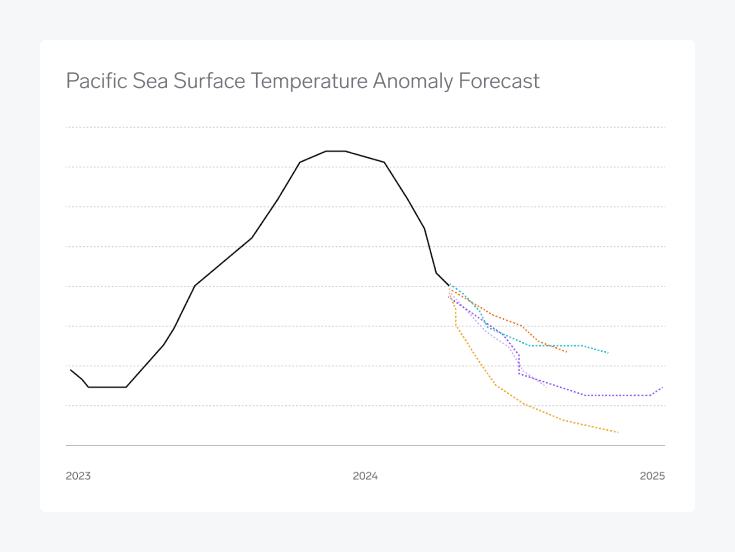
Contributing to major shifts in global weather patterns, the El Niño – Southern Oscillation (ENSO) is the measure of the fluctuating Pacific Ocean temperatures that create both El Niño and La Niña events. Such events can result in many regions experiencing prolonged and extreme weather, which can significantly threaten commodities. Expana tracks and monitors the ENSO along with multiple global forecast models to gain insight into potential future meteorological anomalies.

Weather report
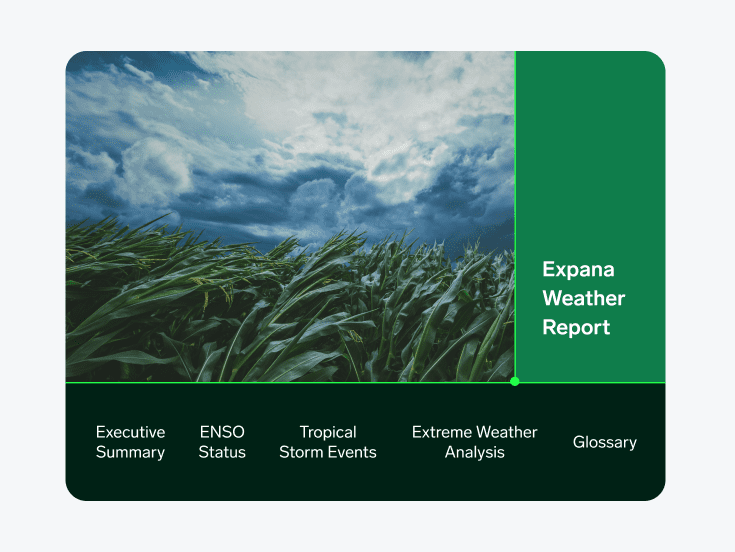
Collating global weather events and extremes, Expana publishes a monthly weather report containing a comprehensive overview of the status of the global climate and insights into impacted commodities. The report includes an ENSO update, an insight into consequences of tropical storms, and more detail into commodities that are growing under the most extreme conditions.
Related weather insights

Canada’s Canola Yields at Risk Due to Dry July

July Heatwave Disrupts Cotton, Garlic, and Corn Growth in China

Heat Threatens Romania’s Corn and Sunflower Crops
Comprehensive weather insights that drive supply chain resilience
Expana provides comprehensive insights into the intricate dynamics of weather and agriculture, empowering strategic decision-making and helping businesses stay ahead of market disruptions.